
The new feature called “Analysis Mode” allows end users and data analysts to analyze data directly on list pages within the application. This means they can examine information without the need to open Excel or run a separate report.
This feature enhances the capabilities by enabling users to add multiple tabs representing different tasks or views on the data, such as “My customers” or “Sales statistics.” It eliminates the need to switch between applications, making it more convenient for users. They can still utilize other tools like Excel or Power BI for more extensive data analysis if needed. To use this feature, users just need to switch to “Analysis Mode” when they are ready to analyze data on a list page.
Table of Contents
Analyzing Data Within Business Central Without Generating Reports
Starting from Business Central 2023 Wave 2 (BC 23) onwards, the Analyze feature is now available by default within Business Central. As you may recall, it was previously accessible as a pre-release feature in earlier versions. Microsoft has enhanced this feature and made it available by default for all users. An additional benefit is the removal of the previous limitation of 100K rows. The best part is that it will allow you to create multiple analyze dashboards inside any list page and will remember them when you visit next time. Not only these having lot more let us explore the same here.
How to Use Analyse Feature in Business Central ?
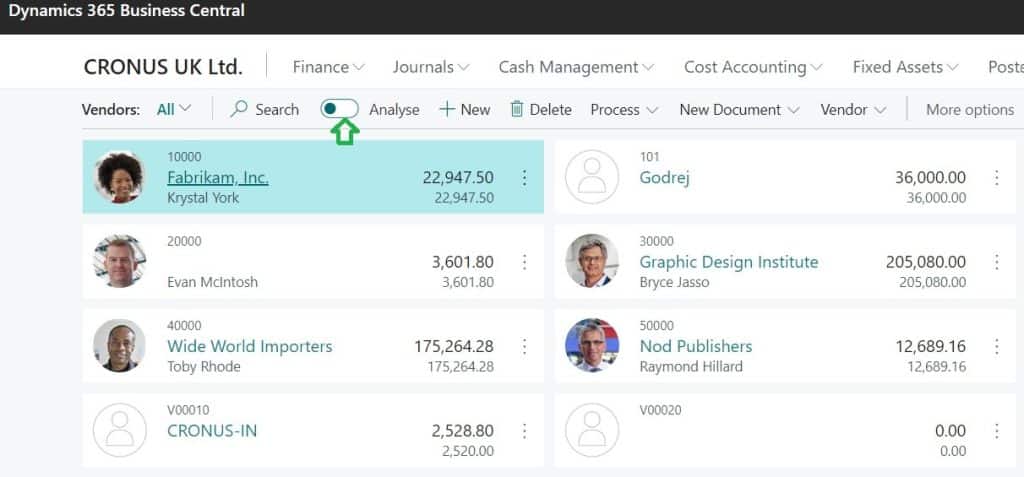
For start using the feature from Business Central 2023 Wave 2 ( BC 23) you can see Analyse Enable or Disable option on any list pages (Example, vendor list, Customer List, General Ledger Entries etc.)
In order to use the same just need to activate the same just like below image.
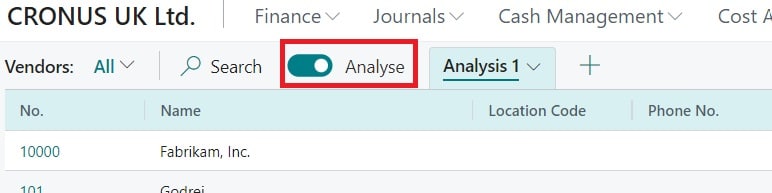
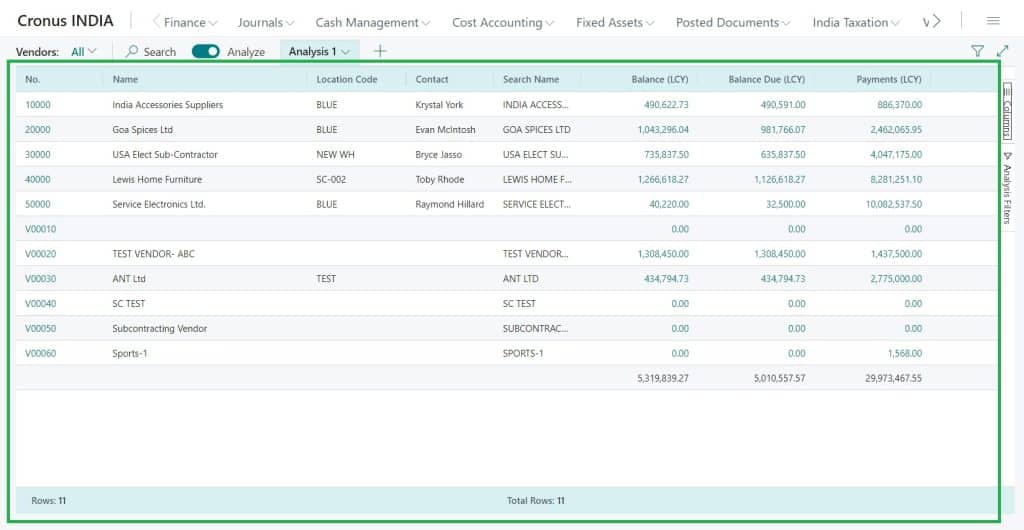
Once activated, you may be able to see right side “+” create new dashboards. In individual tabs, you add a different set of columns or total fields depending on your needs.
You are also having feature to filter the records using standard page Filter option or filter individual fields like Excel pivot works (Contains , Not Contains, Equals , Not equal, Starts with, Ends With, Blank, Not Blank). Will demonstrate all these in this post itself so continue reading.
Analysis mode creates a new way to look at data, designed specifically for analysis. In this mode, the page is divided into two parts:
- The main data area, which includes a Tabs pane.
- The field modifier area.
Data Area in Business Central
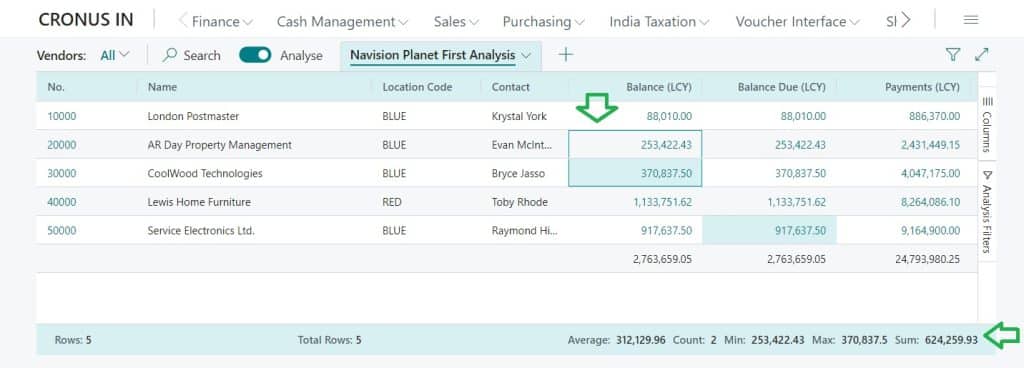
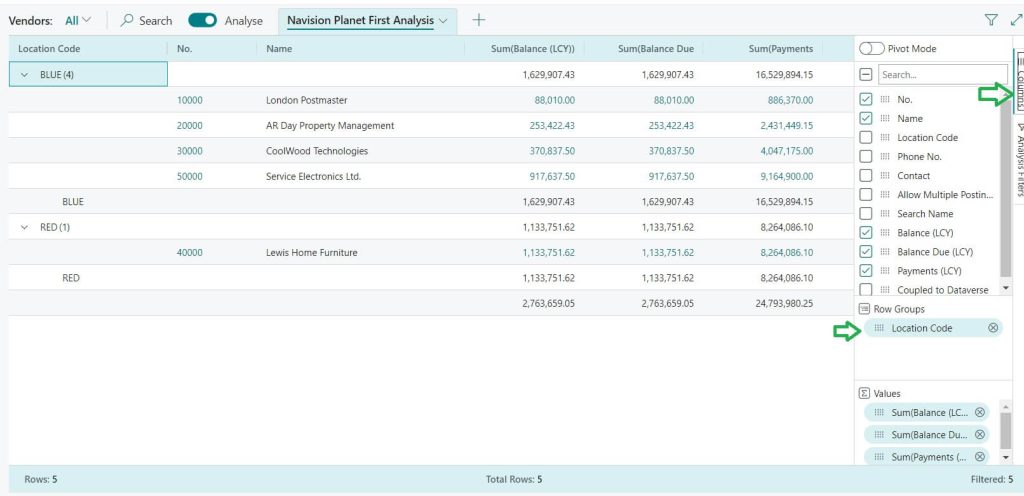
Interact with the data in the data area. If there are columns that can be added up, you can quickly get information like averages and totals for a group of fields by selecting them. At the bottom of the data area, you can see the total number of rows in the column.
The following Image shows the ways to get total of a selected record directly in Business Central.
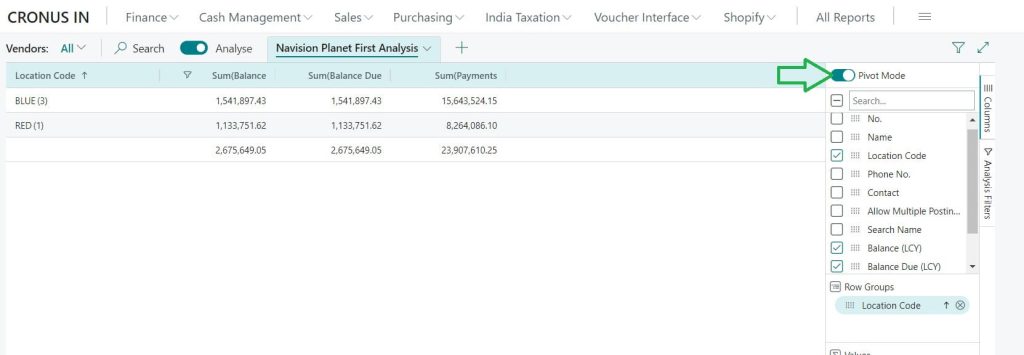
Pivot option in Business Central Analyze Feature can enable by enabling following option.
Field Modifier Area in Business Central
Control how data is displayed and formatted using the field modifier area. Choose which fields to show or hide from the menu. You can group data by dragging fields to the Columns menu’s Grouping section, allowing you to explore data grouped by specific fields to the left of the data area.
For enhanced grouping, switch to pivot mode by toggling the Pivot Mode switch. Then, drag fields to the Values section for summation. Define groups in the column part by dragging fields to the Column Labels section of the Columns menu. Keep in mind that column grouping works best with fields containing only a few values.
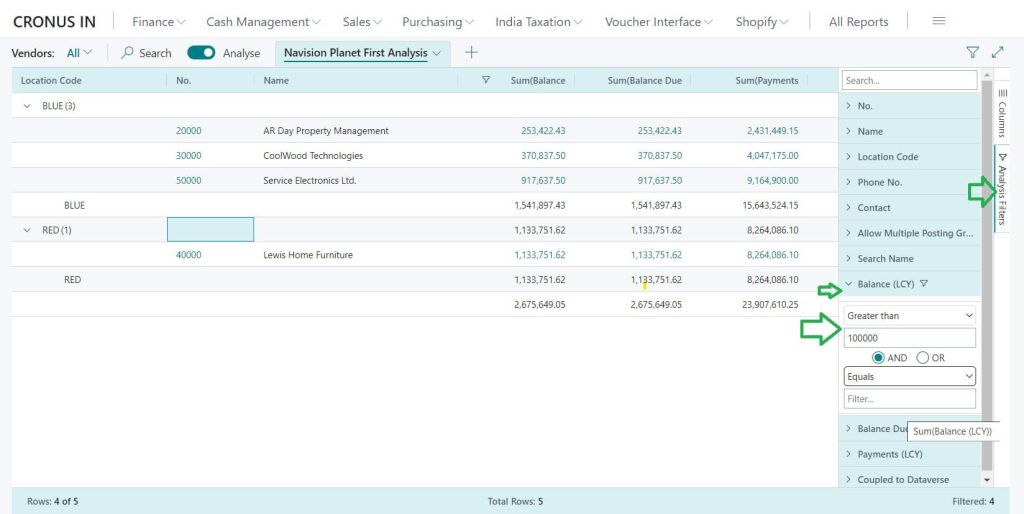
To apply additional filters to the dataset, use the Additional Filters menu in the field modifier area. This is handy when you want to focus on specific customers or a particular time period during your analysis.
You may also get feature to filter option or filter individual fields like Excel pivot works (Contains , Not Contains, Equals , Not equal, Starts with, Ends With, Blank, Not Blank).
To obtain these kinds of results, simply click on ‘Analysis Filters’ and then drill down on the field you want to filter records, as explained in the following image.
How to Create Multiple Analyze Dashboards within Single List Page
You may create Business Central Analyse tabs 3 different ways.
- Manual Method to Create Analyse dashboard
- Getting a Dashboard From Collegue or Friend
- Use readily available templates.
Manual Method to Create Analyse dashboard : This is the default option, as explained in the initial topics of the current post. Someone should create it manually based on their needs.
Getting a Dashboard From Collegue or Friend: This is feature available with latest Business Central. Now we can share the prepared custom report dashboard to your friends or colleagues.
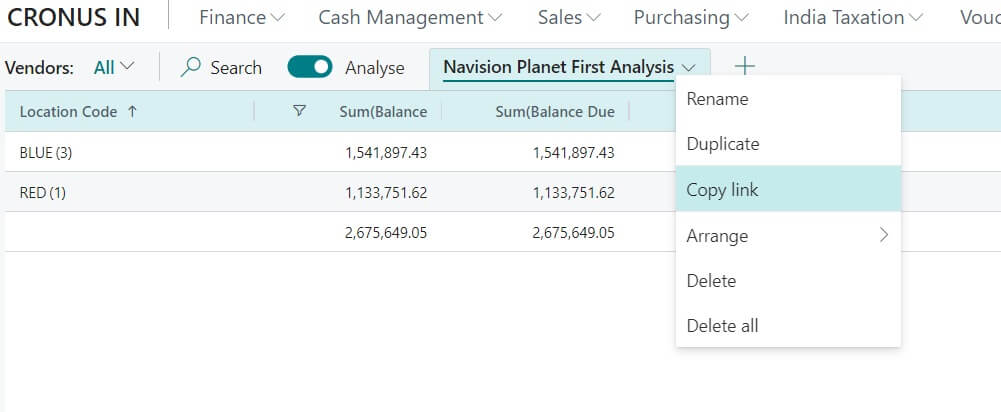
Once you have shared the link with different person, he / she can modify the name of report if required. Also possible to modify the fields or filters as per needs but it will not change original filter or data.
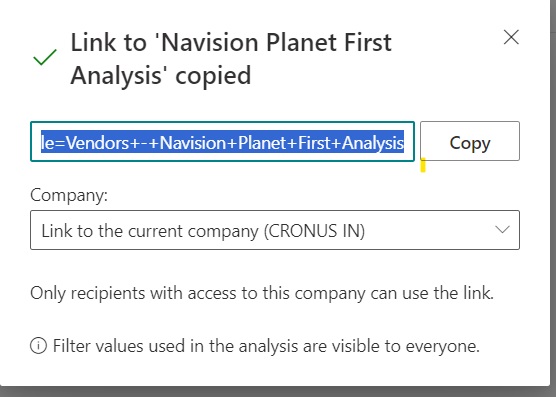
You may share this to any colleague of yours or receive it.
if you are receiving this link then you will get one popup to confirm the name of the report. You will get option to edit the name and modify fields or filters etc.
Use readily available templates: Microsoft has also provided links to prepare common financial reports, so you may not be required to build a report dashboard from scratch.