Quick Answer
The Item – ABC Analysis report is a new standard report in Business Central 2026 (BC28). It ranks your inventory items into A, B, and C categories based on their share of total sales value, so you can see which items drive the most revenue. You set your percentage thresholds once on the ABC Analysis Setup page (they must total 100%), then run the report to get an Excel output with print and analysis worksheets.
Not all inventory is equal. A small handful of your items probably drive most of your revenue, while a long tail of products barely moves. The trouble is knowing exactly which items fall into which group and that’s precisely what the new Item ABC Analysis report in Business Central 2026 does for you.
In this guide, we’ll explain what ABC analysis is, why it matters, and how to set up and run the new report step by step. It’s a genuinely useful tool for anyone managing stock, so let’s dig in.
Table of Contents
What is ABC Analysis?
ABC analysis is a classic inventory management technique based on a simple idea: focus your attention on the items that matter most. It sorts your products into three groups by how much they contribute to sales value.
| Category | What It Means |
|---|---|
| A items | Small volume, high value. These drive the most revenue always keep them in stock. |
| B items | Medium volume, medium value. Important, but not as critical as A items. |
| C items | High volume, small value. You might accept the occasional stock-out for these. |
The report calculates each item’s share of total sales in your local currency (LCY), then classifies items by the percentage thresholds you define. The payoff is focus: you channel your supply chain effort purchasing, warehouse space, safety stock toward the items that actually matter, and stop over-investing in ones that don’t.
💼 From 18 Years in the Field
The real value of ABC analysis isn’t the report – it’s the questions it forces you to ask. Your A items must never run out. But your C items deserve scrutiny: does a product that’s 2% of your sales really justify warehouse space, or should it become a drop-ship or special-order item? ABC gives you the data to make those calls instead of guessing.
What’s New in Business Central 2026
ABC analysis itself isn’t new as a concept, but in 2026 release wave 1 (BC28), Microsoft added it as a proper standard report inside Business Central the Item – ABC Analysis report, delivered as an Excel report. Previously this kind of analysis was mainly available through Power BI.
The key improvement is that you now configure your thresholds once on a dedicated setup page, and those same thresholds are used by both the standard Excel report and the ABC Analysis Power BI report. So your classification stays consistent no matter where you view it the report reflects your business logic, not a one-size-fits-all default.
Item ABC Analysis Setup – Setup Missing Error
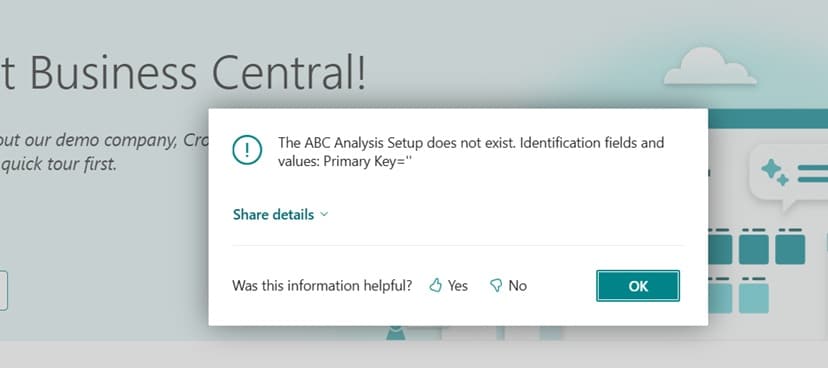
Please note if you are not setup the Item ABC Analysis report and its running first time then will get following error. Don’t worry If you following Step by step setup instruction provided on next topic will resolve that error.
The ABC Analysis Setup does not exist. Identification fields and values: Primary Key=''
Item ABC Analysis Report Enabling Setup Steps
Following are the steps needs to be follow for setting up Item ABC Report of Business Central.
Step 1 : Set Up Your ABC Thresholds
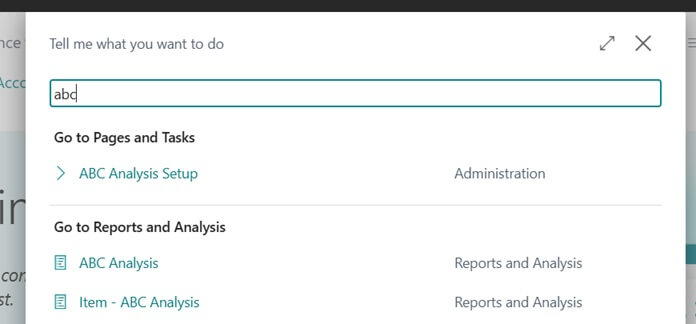
Before running the report, you define what counts as an A, B, or C item. Press Alt + Q, search for ABC Analysis Setup, and open the page.

Here you enter the percentage for each category.
The important rule: the three values must total exactly 100%. If they don’t, Business Central shows an error and won’t let you proceed. A common starting point might be something like A = 65%, B = 25%, C = 10% of cumulative sales – but you should tune these to your own business. These values act as the default each time you run the report.

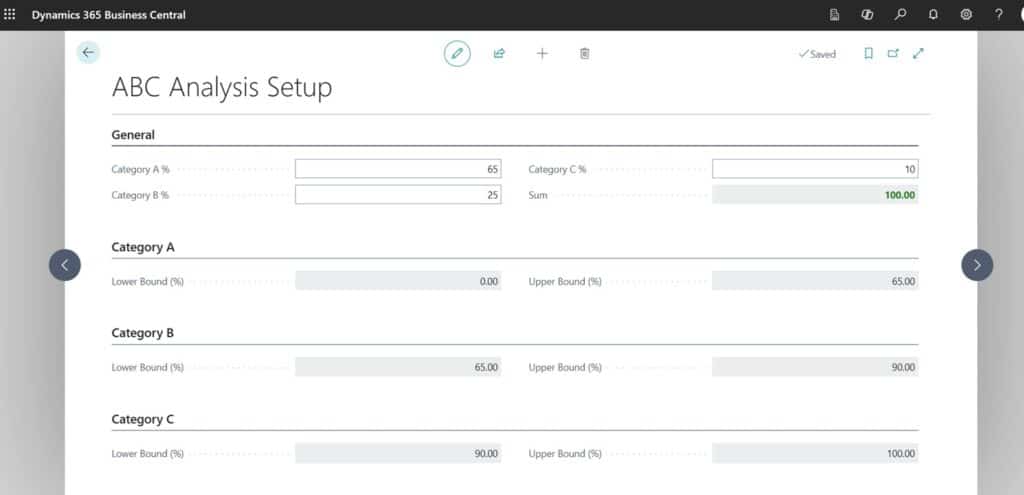
📌 Good to know: The thresholds on the setup page are just the defaults. You can override them on the report’s request page each time you run it handy when you want to test a different split without changing your standard setup.
Warning Message while setting up ABC Analysis Report
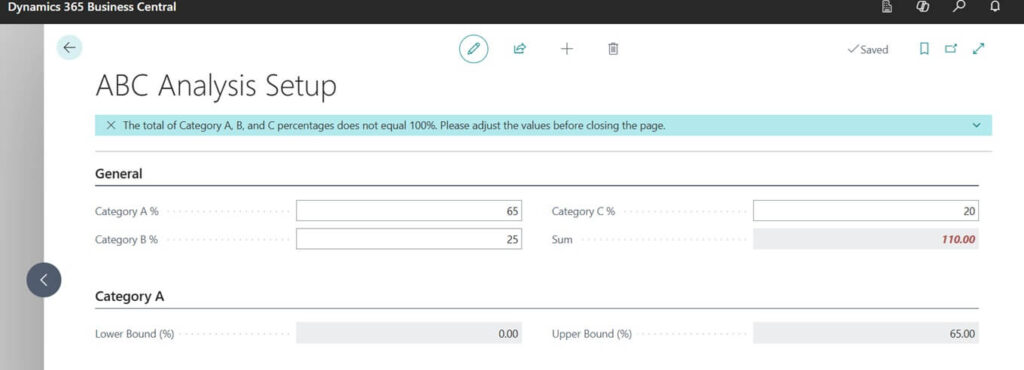
Kindly note if you are getting any warning message while setting like following then its due to Total of Category A% + Category B% + Category C% should be equal to 100. If not you will get following warning or error message.
The total of Category A, B, and C percentages does not equal 100%. Please adjust the values before closing the page.
Step 2 : Run the Item ABC Analysis Report
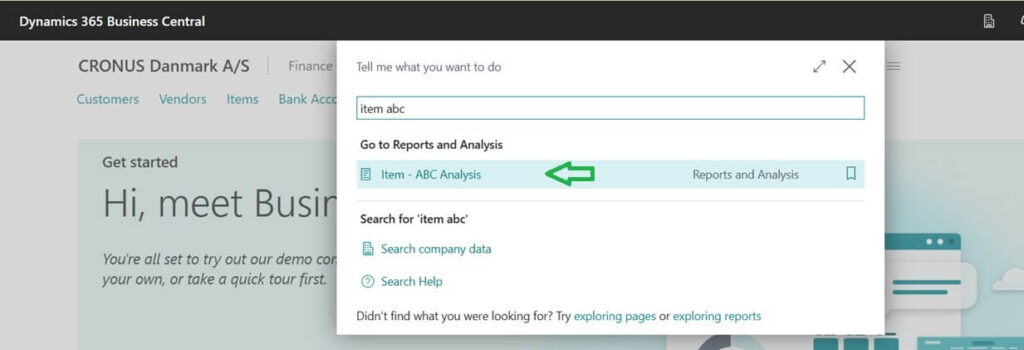
Once your thresholds are set, press Alt + Q and search for Item – ABC Analysis (or open it from the report list).

On the request page you’ll see your default category thresholds, which you can adjust for this run if you like. On the Item FastTab, you can apply filters to control exactly which items the report includes for example, a specific item category or location.

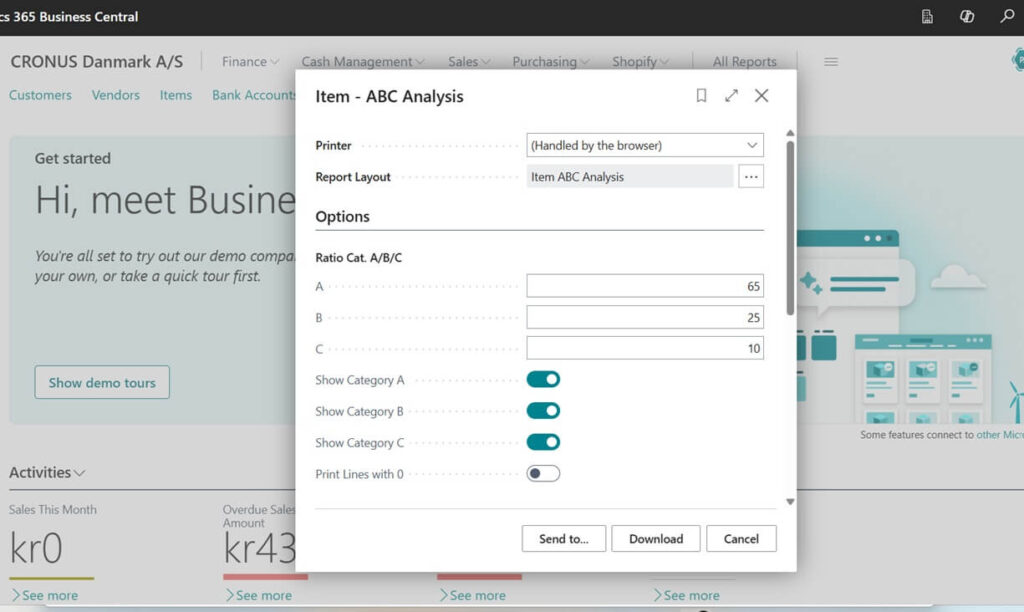
Print Lines with 0 : Specifies that lines with no valuation are included. These lines are often excluded from the analysis.
When you’re happy with the settings, run the report / Download button to get full excel result. Business Central generates an Excel file with the results.

Step 3 : Read the Excel Output
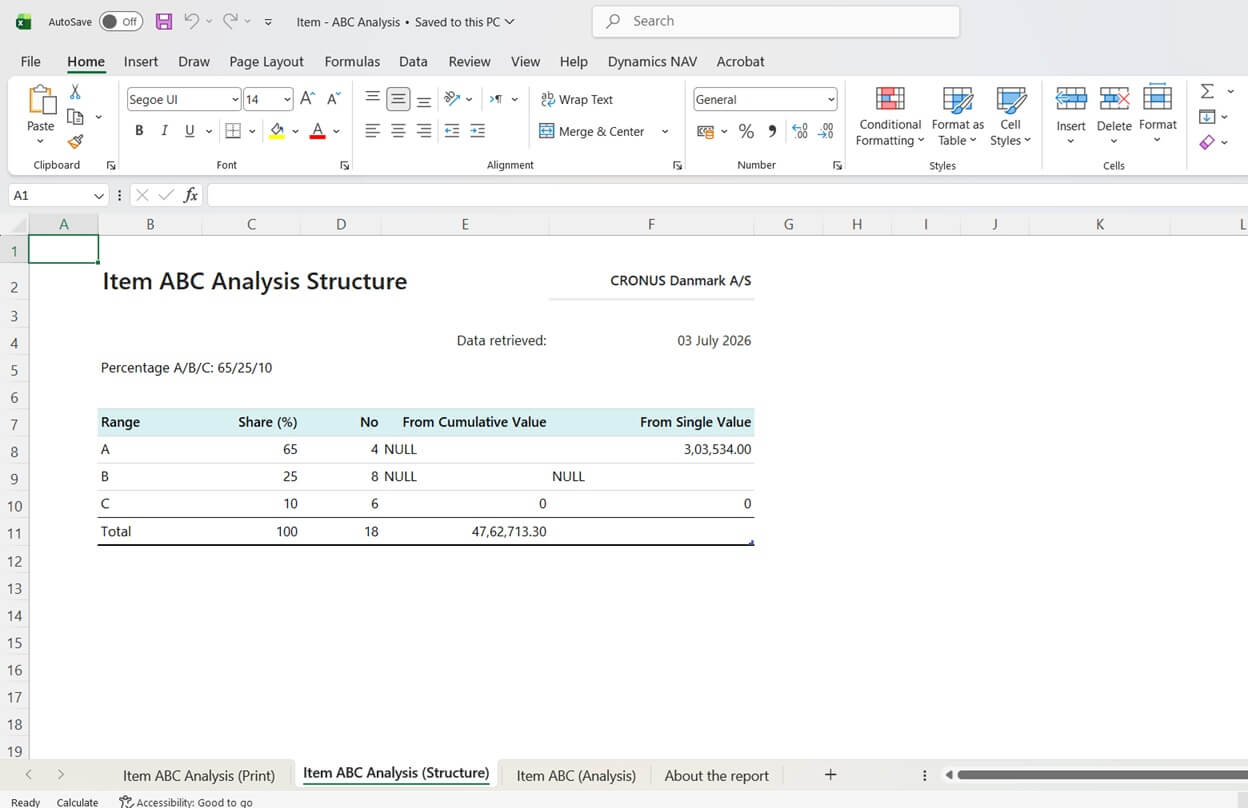
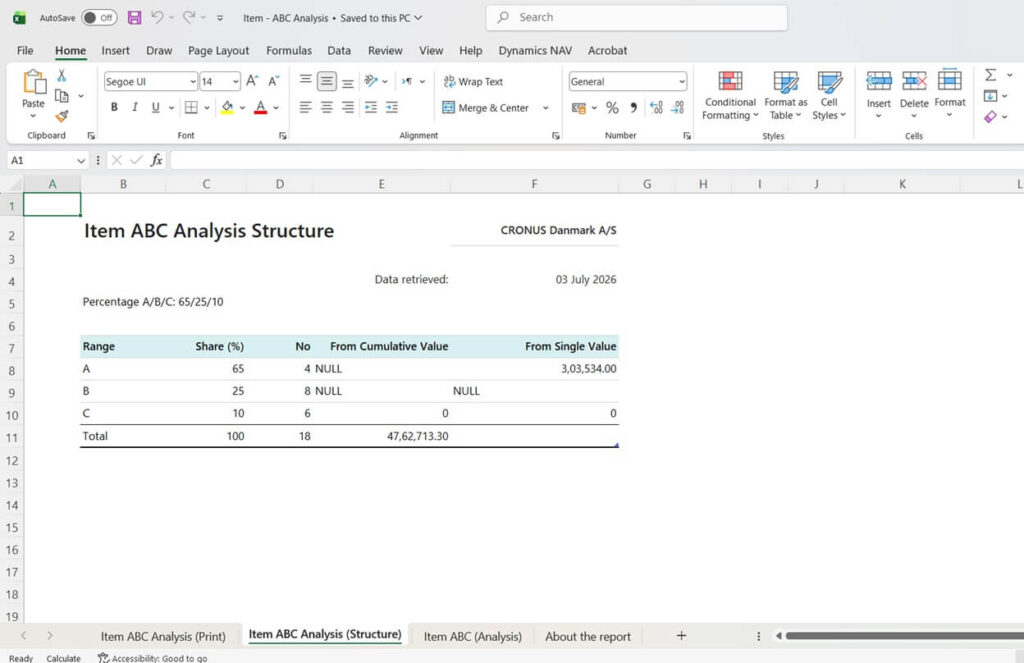
The report comes as an Excel workbook with three worksheets, each built for a different purpose:
| Worksheet | What It Shows |
|---|---|
| A printable version with item details and their ABC classifications designed to fit on paper. | |
| Structure | A summary of the cumulative values for each ABC class the big-picture breakdown. |
| Analysis | An interactive worksheet with slicers for ABC class and inventory posting group, so you can slice and dice the data. |
The Analysis worksheet is where the real exploration happens. Using the slicers, you can quickly filter to just your A items, or look at one inventory posting group at a time, to spot patterns and make decisions.

How to Act on the Results
The report is only valuable if it changes what you do. Here’s how each category typically translates into action.
For your A items, the goal is availability. These are your revenue drivers, so set higher safety stock, review them frequently, and make sure they never run out. A stock-out on an A item is a direct hit to your sales.
For your B items, aim for balance — reasonable stock levels and periodic review, without the intense attention A items get.
For your C items, question everything. These are high-volume, low-value products that can quietly soak up warehouse space and admin time. Consider lower stock levels, less frequent ordering, or switching some to drop-ship or special-order. It’s often fine to accept the occasional stock-out here.
Common Questions
By each item’s share of total sales value in local currency (LCY). Items are sorted into A, B, and C categories based on the percentage thresholds you set.
Yes. On the ABC Analysis Setup page the three category values must total exactly 100%, or Business Central shows an error and won’t let you continue.
Yes. The setup page holds your defaults, but you can override the thresholds on the report’s request page each time you run it, without changing your standard setup.
The new standard Item – ABC Analysis report is an Excel report. A separate ABC Analysis Power BI report also exists, and both use the same thresholds from the setup page, so the classification is consistent across them.
The standard Item – ABC Analysis report was introduced in Business Central 2026 release wave 1 (BC28). If you’re on an earlier version, you’d need to use the Power BI approach instead.
Print (a printable version), Structure (cumulative values per ABC class), and Analysis (an interactive sheet with slicers for ABC class and inventory posting group).
Final Thoughts
The new Item ABC Analysis report is a small feature with a big payoff. In a few minutes you can see exactly which items carry your business and which ones barely earn their place on the shelf. Set your thresholds once, run the report, and use the Analysis worksheet to guide smarter purchasing and stocking decisions.
If you’re on Business Central 2026, it’s well worth adding this to your regular routine a quarterly ABC review can meaningfully reduce stock-outs on your best sellers while trimming waste on the rest.
Stay tuned to NavisionPlanet for more simple, step-by-step Business Central guides drawn from real project experience.